Monthly Sales Statistics.
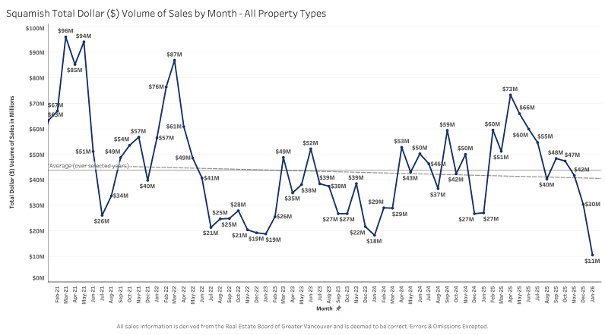
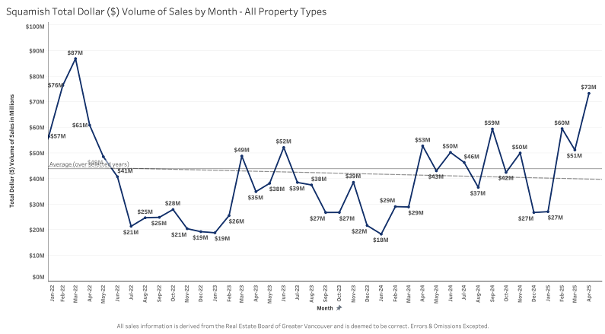
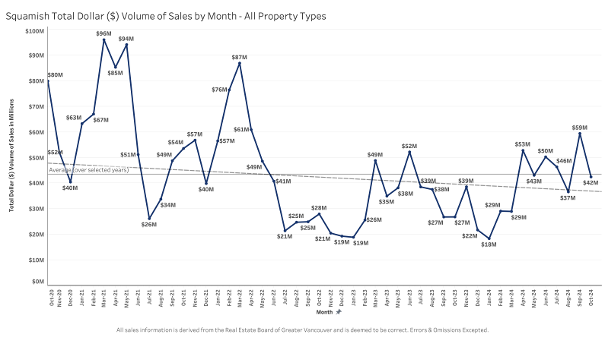
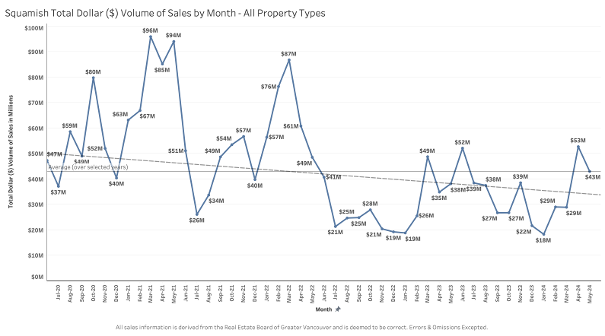
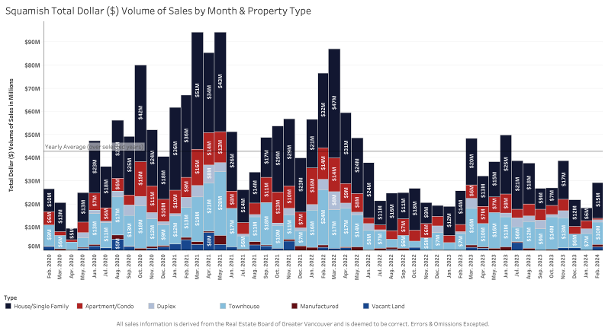
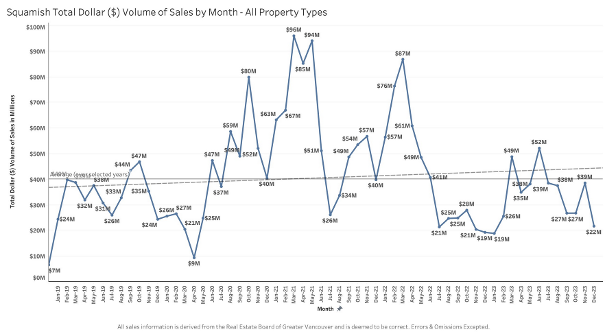
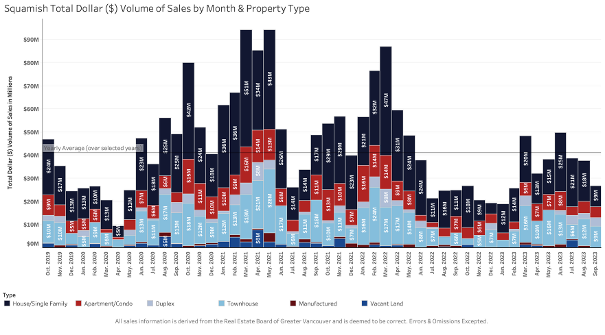
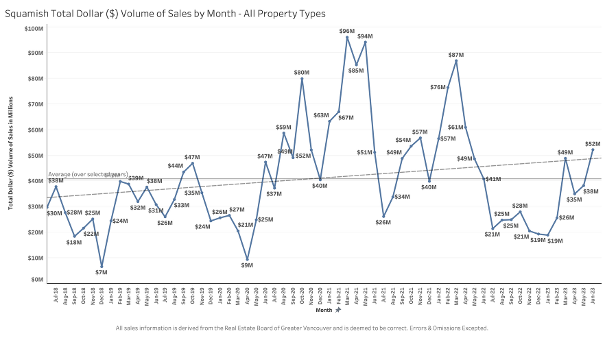
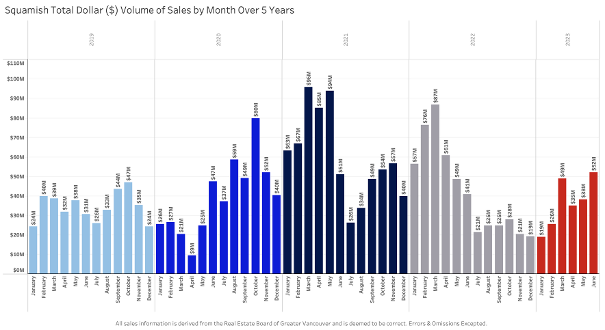
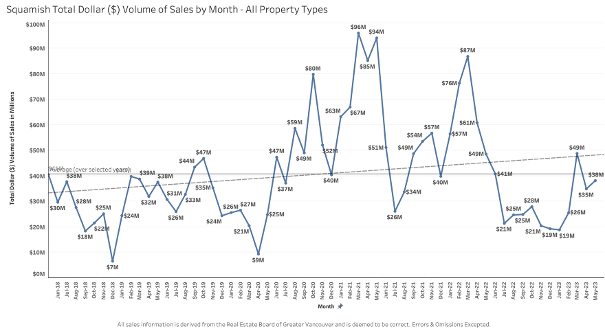
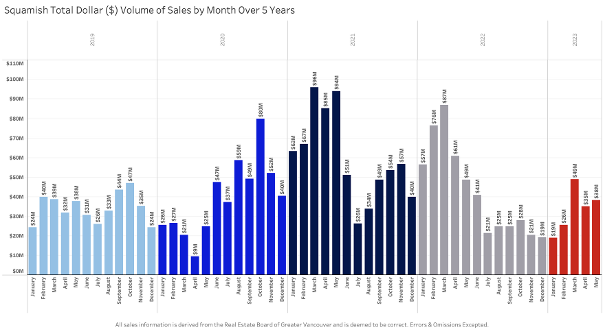
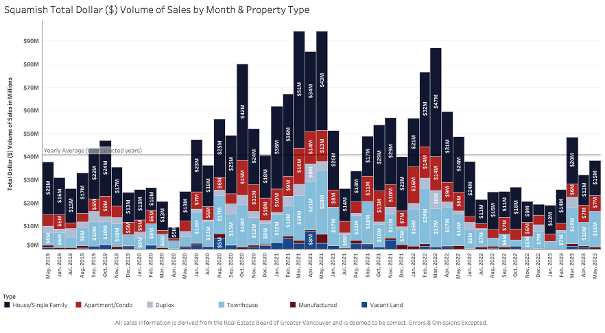
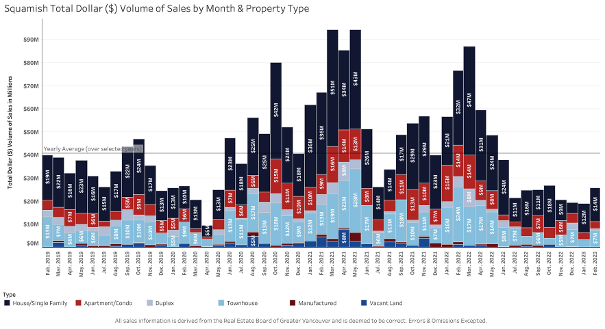
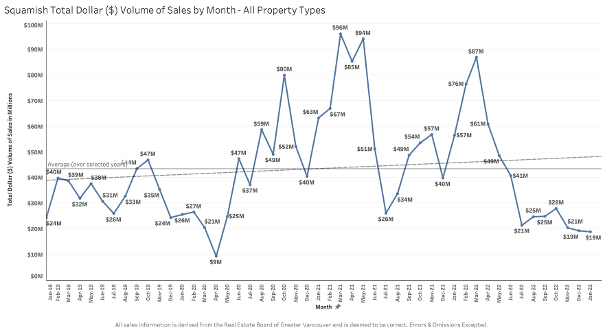
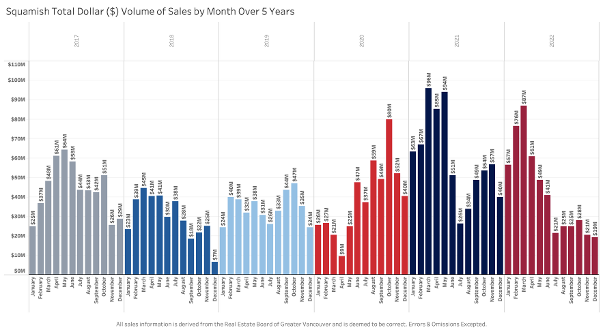
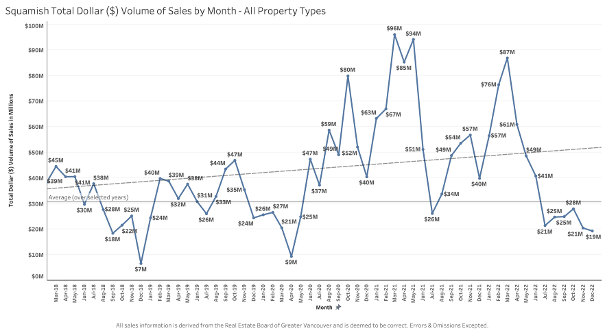
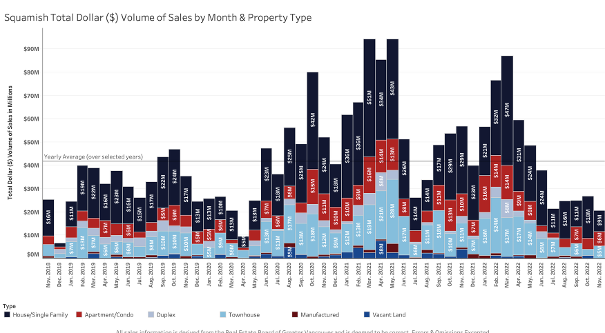
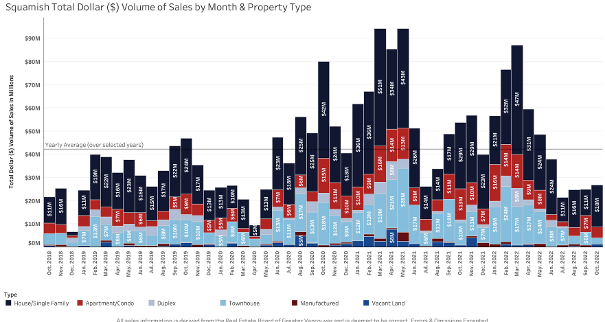
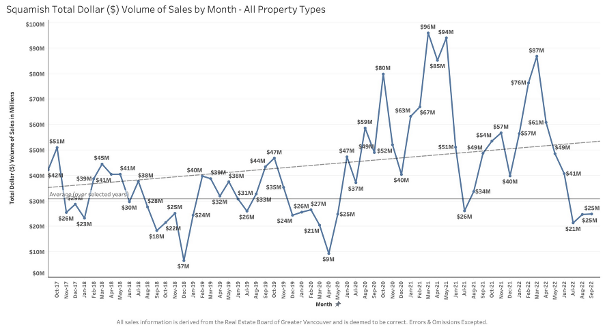
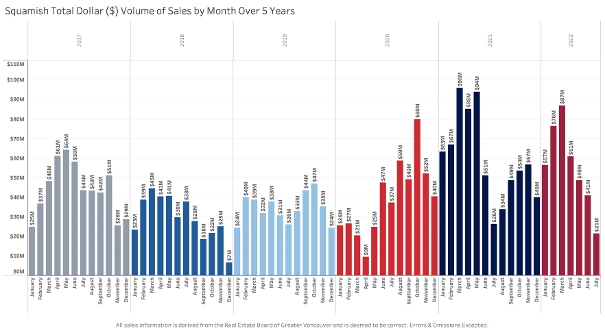
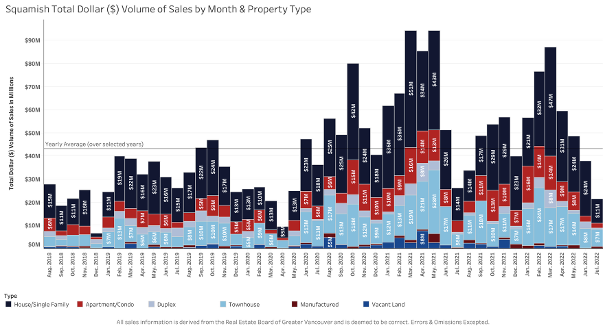
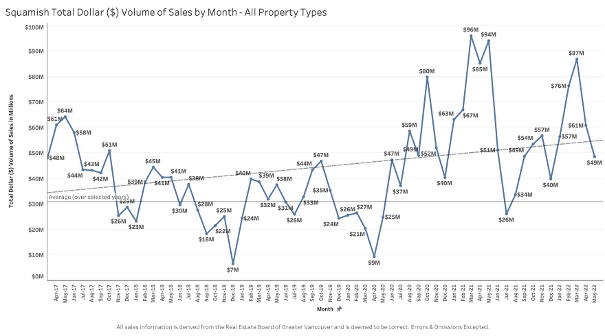
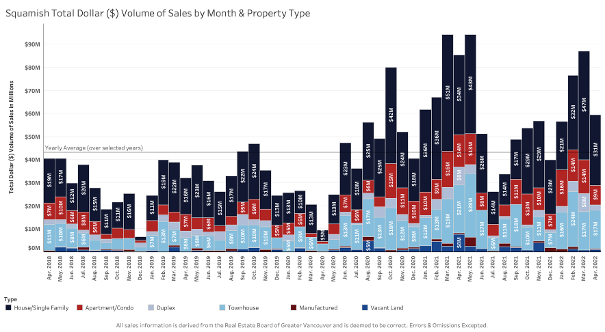
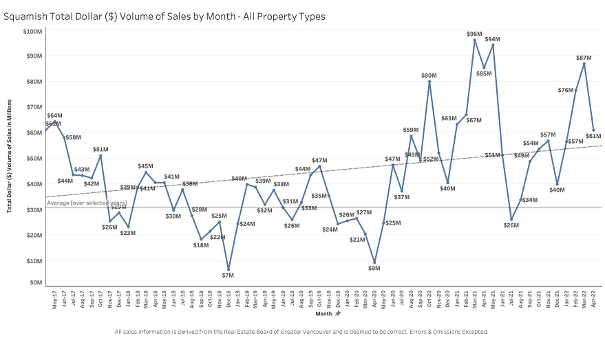
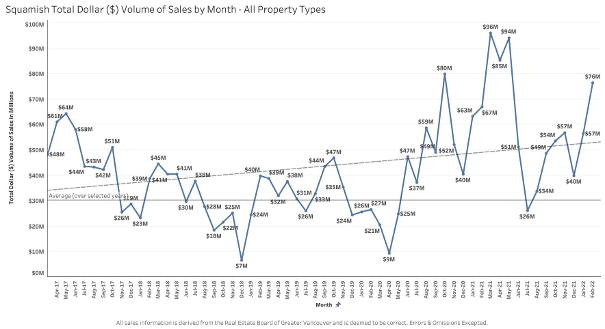
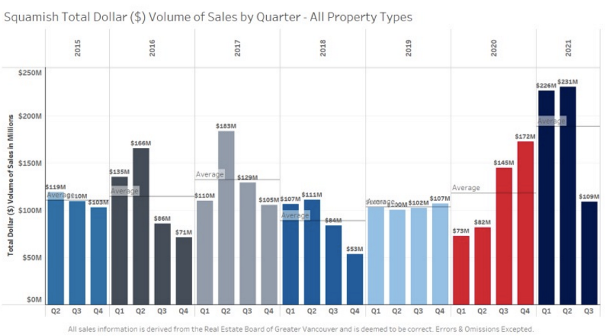
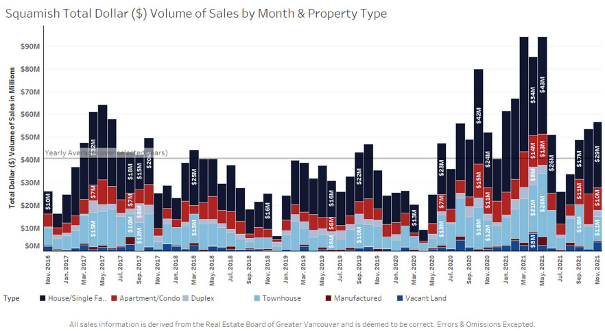
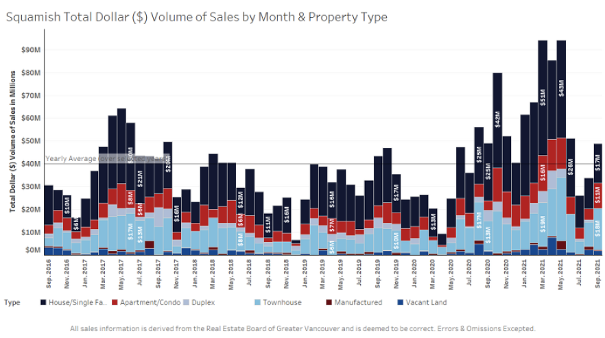
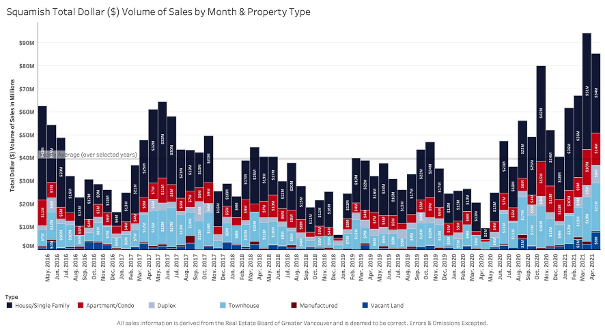
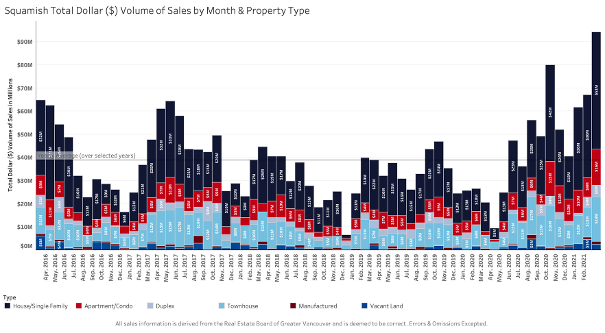
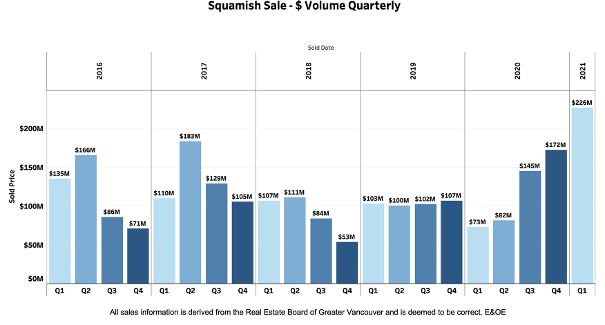
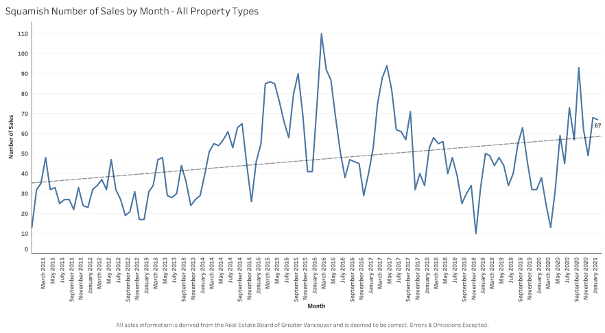
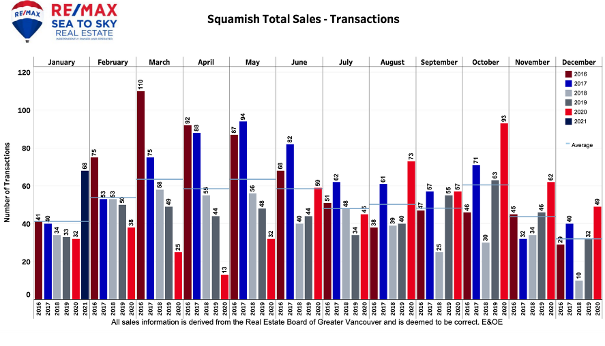
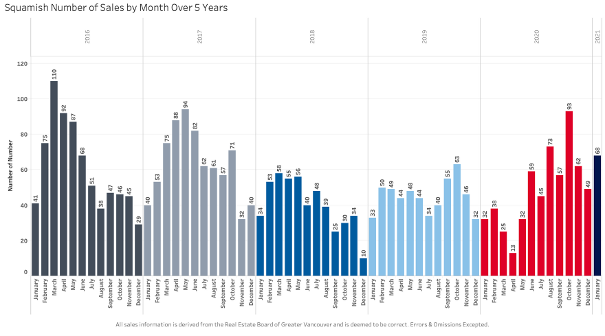
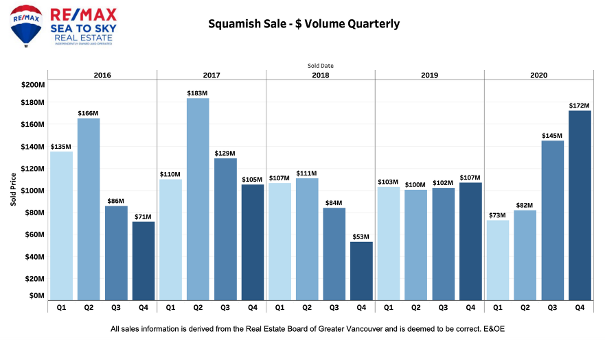
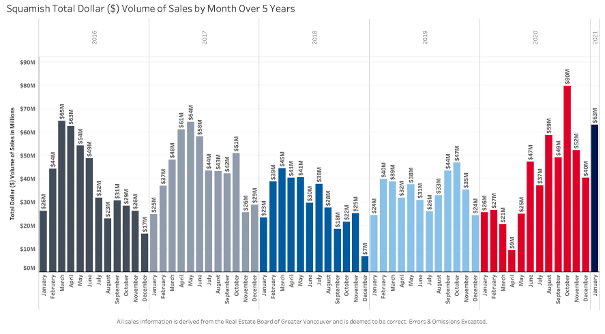
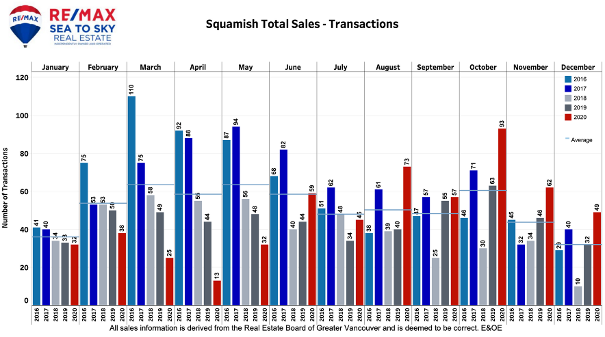
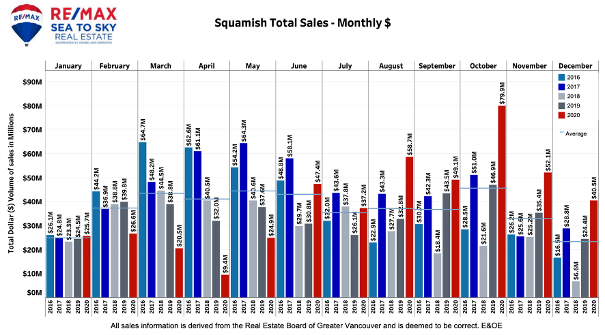
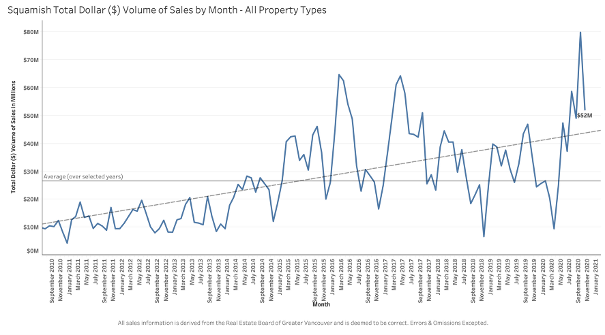
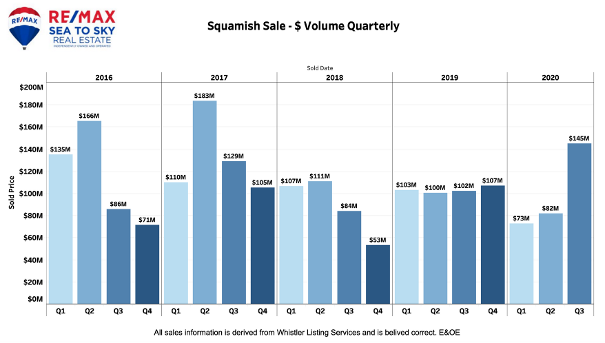
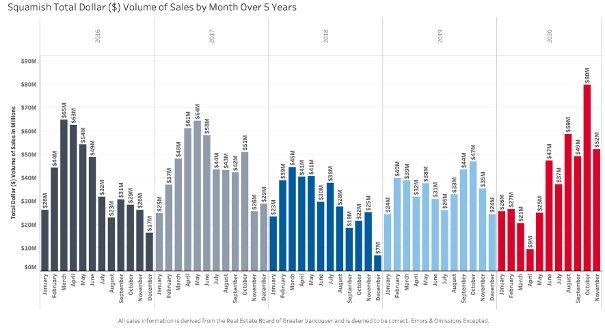
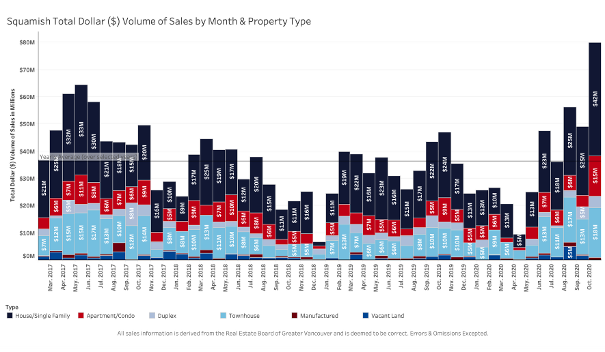
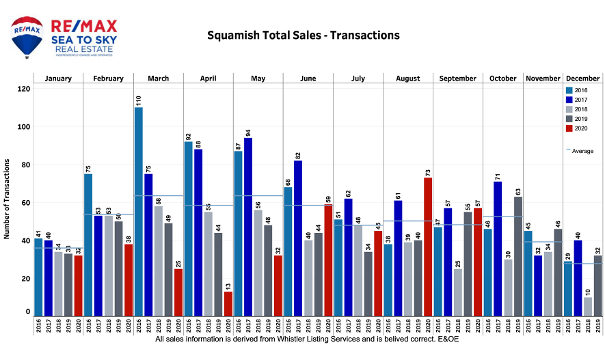
The attached graphs will show you sales volume and number of sales by different styles and zoning of property over a 4 year period so you can see trends and activity for Squamish. Click on the image to view more.
Squamish Statistics through January 2026
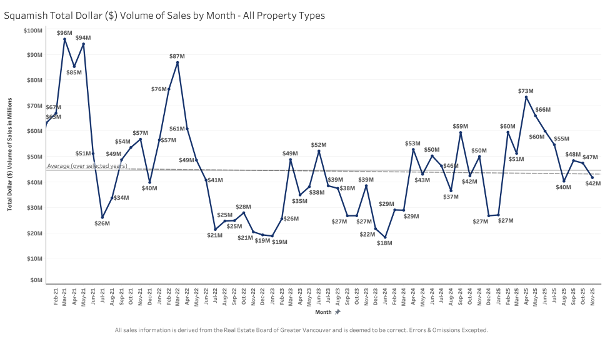
Squamish Statistics through July 2025
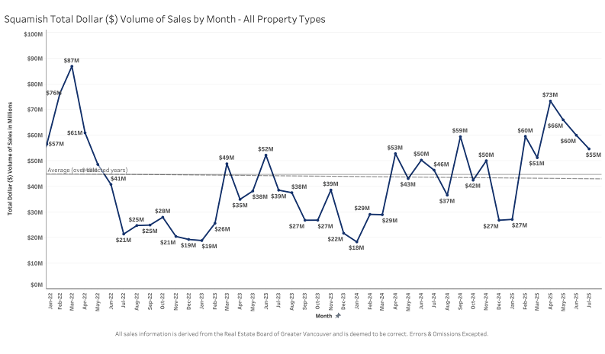
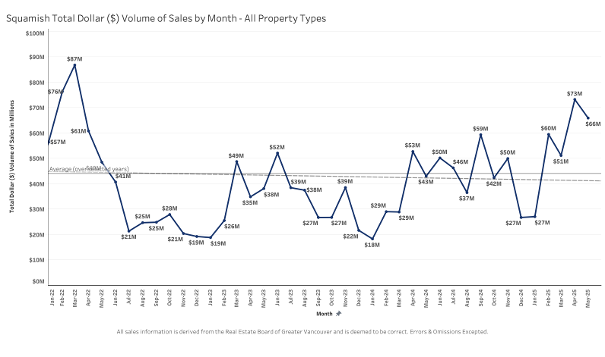
Squamish Statistics through May 2025
Squamish Statistics through April 2025
Squamish Statistics through October 2024
Squamish Statistics through September 2024

Squamish Statistics through July 2024

Squamish Statistics through May 2024
Squamish Statistics through April 2024

Squamish Statistics through February 2024
Squamish Statistics through January 2024

Squamish Statistics through December 2023
Squamish Statistics through November 2023

Squamish Statistics through October 2023

Squamish Statistics through September 2023


Squamish Statistics through August 2023

Squamish Statistics through July 2023

Squamish Statistics through June 2023

Squamish Statistics through May 2023
Squamish Statistics through April 2023


Squamish Statistics through February 2023

Squamish Statistics through January 2023

Squamish Statistics through December 2022

Squamish Statistics through November 2022


Squamish Statistics through October 2022

Squamish Statistics through September 2022

Squamish Statistics through August 2022


Squamish Statistics through July 2022

Squamish Statistics through June 2022


Squamish Statistics through May 2022


Squamish Statistics through April 2022

Squamish Statistics through March 2022


Squamish Statistics through February 2022

Squamish Statistics through January 2022


Squamish Statistics through December 2021


Squamish Statistics through November 2021

Squamish Statistics through October 2021


Squamish Statistics through September 2021

Squamish Statistics through August 2021


Squamish Statistics through July 2021


Squamish Statistics through June 2021


Squamish Statistics through May 2021


Squamish Statistics through April 2021


Squamish Statistics through March 2021


Squamish Statistics through February 2021


Squamish Statistics through January 2021
Squamish Statistics through December 2020


Squamish Statistics through November 2020

Squamish Statistics through October 2020


Squamish Statistics through September 2020


Questions? We can help!
Contact by email
Telephone:
(604) 905-8855
Fax:
(604) 932-4120
Toll Free:
1-888-689-0070


Featured Listings
Featured listing
Location: Pemberton
8 7341 Industrial Way
$0
RE/MAX Sea to Sky Real Estate
Featured listing
Location: Pemberton
7 7341 Industrial Way
$0
RE/MAX Sea to Sky Real Estate
Featured listing
Location: Pemberton
6,7,8 7341 Industrial Way
$1,998,000
RE/MAX Sea to Sky Real Estate


